


Insights | By Bob Taylor
The ABCs of Digital ROI
In a recent survey, 69% of transformation leaders scored the ability to “justify the value of digital transformation” through ROI as challenging or very challenging.1
And yet, their program only works if they get funding and can implement change. They have to get funding and prove the value in order to get more funding. This is a good reason to sunset business case processes that are created to get the projects financed and then shelved until the project is completed where a comparison for success or failure is made. Instead, we use a methodology that bakes the business case in, allows for learning and adjustment and is used to manage the new capability. This is one of the key pillars of success for your digital transformation: return on investment.
Let’s take a look at three important aspects of digital ROI:
 cquire the financial resources necessary to change the organization.
 uilding Block KPIs: Measuring success and refining the program.
 ontinued Measurement for change and to sustain the value.
A number of clients who ask us about ROI really want ideas that have tangible financial returns that they can implement for digital wins. For those people, please contact us for ideas based on some of the latest projects we have completed, or we can discuss our Ideation Methodology and collaborative approach to innovation which yields big ideas and is now the fastest-growing solution in our portfolio. I have included one idea as an example in this article – identifying more anonymous visitors to the corporate website.
Also, some projects may require us to determine the value of an engaged or more loyal, customer and while these are specific to each company, we use a similar process. Lastly, we won’t focus on the cost side in this report due to length but will circle back at a later date.
– Acquiring the Financial Resources
For those people who want to better understand how we are able to come up with solid business cases for digital ideas, it starts with the understanding that most businesses are still designed to measure transactions and have difficulty measuring digital success in areas of customer relationship, innovation, and operational agility, etc. While we utilized six buckets of capability areas for measurement against, listed in the diagram below three categories of often used metrics that digital business cases have aligned with for digital transformation.
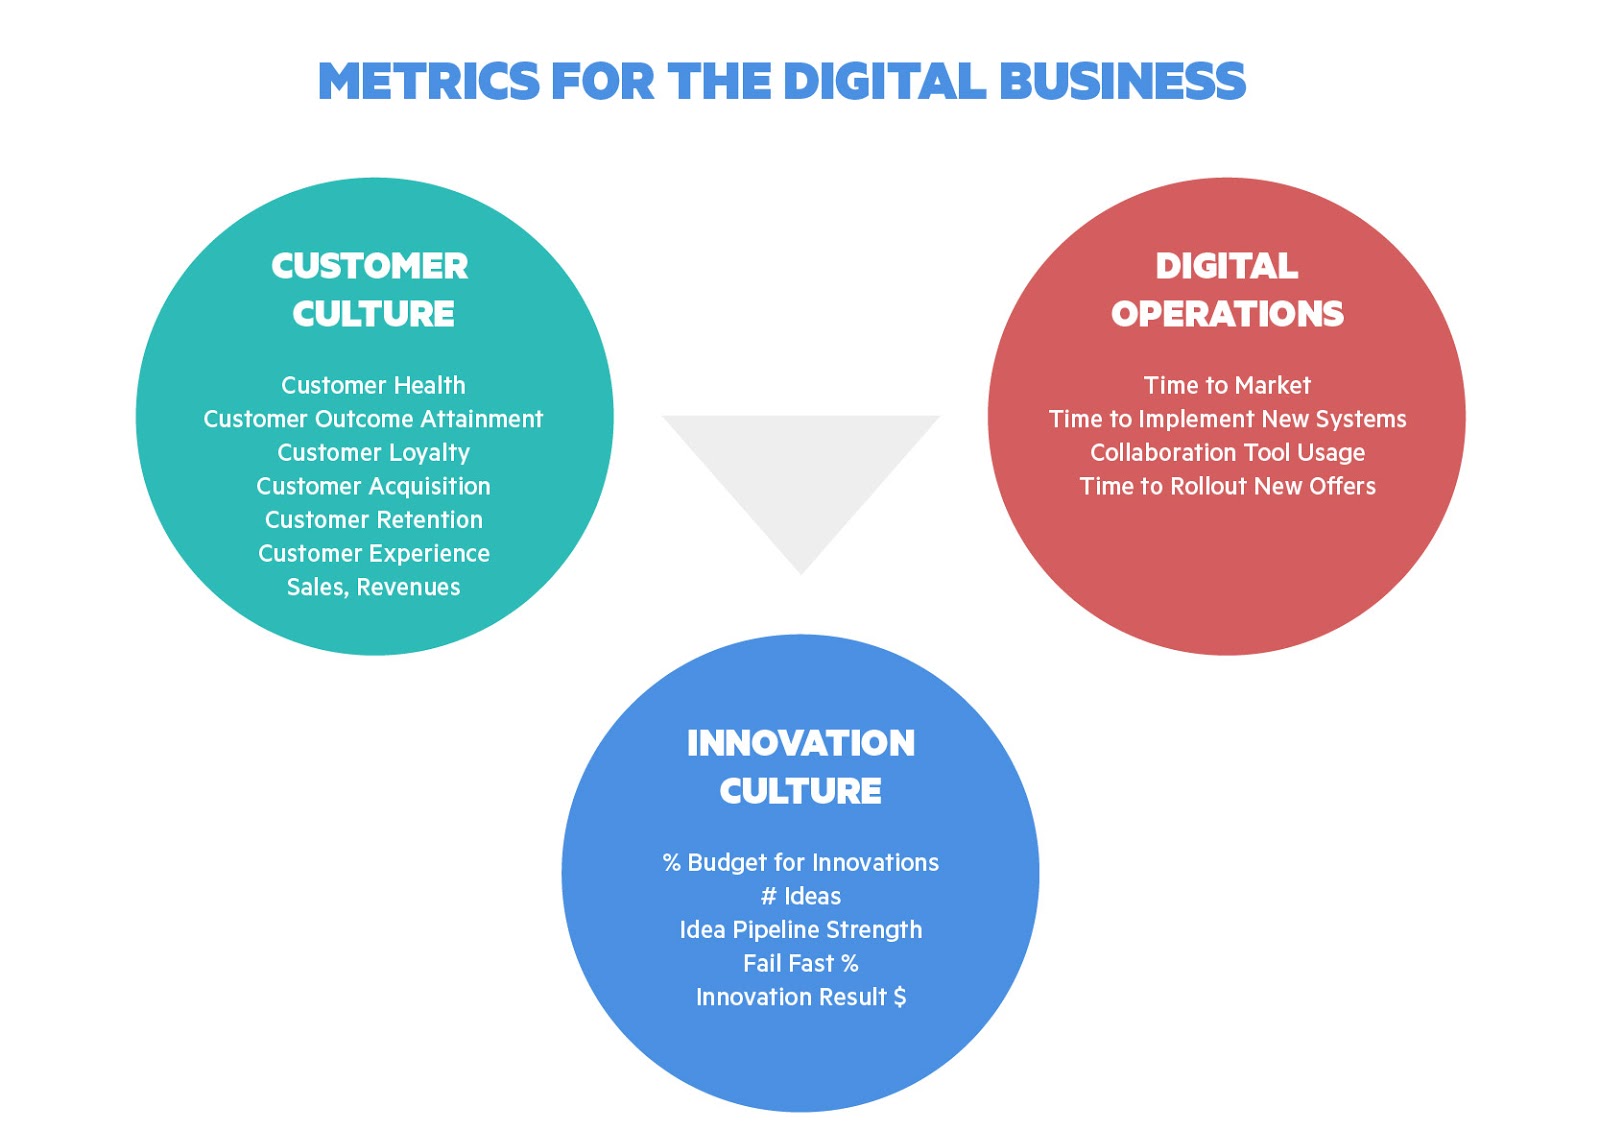
Customer Culture: measures how focused a company is on their customers, how much do they know about them, whether they are focused on helping the Customer be successful with their business goals through the greater use of their product.
Innovation Culture is the ability for the company to come up with new product ideas, new connection ideas and the speed at which the organization learns and iterates.
Digital Operations will have traditional people and financial measures along with KPIs that measure how fast and agile an organization can take advantage of changing customer needs or market trends.
If your company has a balanced scorecard or enterprise KPIs for these areas, then you are ahead of the curve! If not, then we go through a short process that aligns the KPIs with building block measures (both Transactional Measures and Qualitative Measures), that in turn will roll up to the more traditional enterprise KPIs.
– Building block new measures to manage the project.
These “lower level” measures are usually a combination of transactions and qualitative metrics that are used to determine whether the project will be a success, from both a business and financial objective perspective. In many cases, these are new operational measures for an organization based around agility and experience. For example, a simplified version in the diagram below shows how both types of KPIs roll up to higher measures. For this case, we’ll use a new idea that capitalizes on B2B Buyer shopping habits.
Company A (just an example) wants to identify anonymous visitors to their website. The technology and services required for this change are well known, as are the people and process change costs. What is not well known is the return to the company for this effort. Now at first glance, the anonymous visitors may not all convert to a sale, and so the initial feeling may be one of those “hard to quantify” or “looks less scientific and more like art.” However, let’s go top down and see if we can’t see the hard impact on sales.
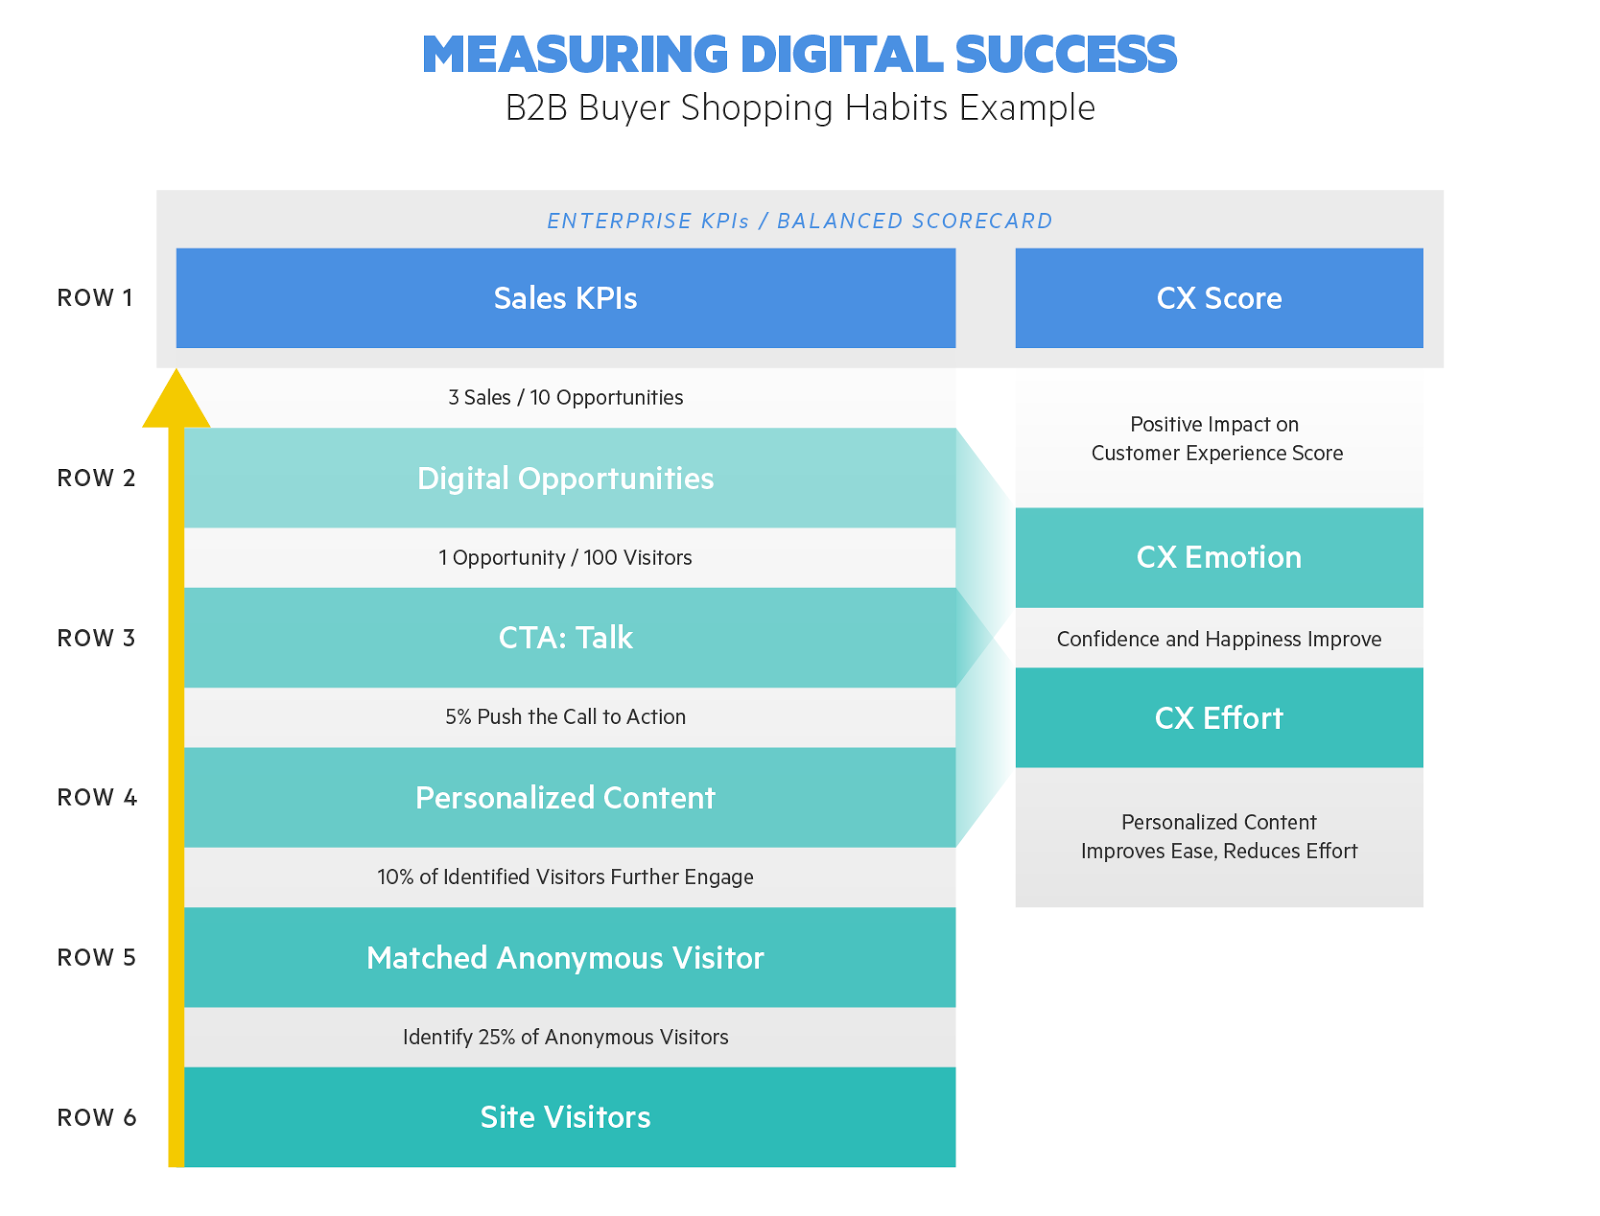
Row 1 is the Sales KPI and would likely be an Enterprise Metric or built into a balanced scorecard.
Row 2 here we have the digital opportunities that come from the website. In this case, we are assuming a 30% close rate for digitally sourced leads into sales (top two rows). So for every ten new opportunities, we get three, sales and we could also track this by sales volume $ or within strategic accounts or a product. This is a simplified model, so we are just tracking the number of sales. Also, the overall Customer Experience Score will be impacted positively, and we may want to track that as well.
Row 3, before we land the digital opportunity, some number of visitors click to fill out the form and set up an appointment (Let’s say 5% for CTA: Talk to a salesperson, for our group). To talk to a sales rep, they are self-identifying at this step and setting up an account.
Row 4, personalized content, possibly using AI or a chatbot to suggest content. This right time right place content can be consumed by the anonymous visitor and move him into shopping mode at an increased rate (10%) as measured by behavior. While some of these prospects may “find” the right content and buy anyway, others may leave and buy from another site. Personalization already exists in this example; we are just picking up the additional identified visitors.
Row 5 contains the matching of the anonymous visitor to a persona. This is required to personalize the content offered and call to action (CTA). Of course, not all visitors are matched, so you still get shoppers content based on behavior and nurturing.
Row 6 as site visitors go up, then matched visitors increase as does everything else up rolling up to the Sales metric.
So in our example, if we can identify just 25% of our anonymous current visitors, then we get an influx of 2.5% of our total web traffic to the personalized content stage, and 5% of those push the call to action to set up an appointment (.125%). Then, a site with 100 visitors a day yields an extra opportunity, and on a 1k a day site, this is an extra 12.5 opportunities per day, 300+ per month. A range is used in some cases, as is a sensitivity analysis. And by breaking the outcome down, during the POC, we can pinpoint where issues are and use root cause analysis to figure out how to optimize the journey to get the desired results.
There is also a CX Emotion score in this example. A CX measurement could also be in the enterprise KPIs - i.e., moving the Customer Experience score higher, and if you are focusing on fixing friction points there will be movement. There are several methods in use today, if this company uses the Tempkin Group BAPI model2, (Behavior, Attitudes, Perceptions, Interactions) this easily supports some of the “Perceptions” metrics. For example, how does the customer feel at steps and activities along the way? Do they feel frustrated, happy, confident, respected or other feelings aligned with the brand? This can also be measured across interaction silos for Omnichannel. The method often includes a version of the Customer Effort Score. There is less effort required to find and binge on content if it is personalized and suggested. These can be measured through surveys, analytics, observation, etc. And like the transactional metrics can be rolled up to an overall CX Score that may be on a balanced scorecard items as well, and we have aligned projects to increases in this KPI. In fact, we maintain a library of metrics (hard and soft)that can be rolled up and have been used to build the financial case for digital successfully and it’s ROI.
– Continued Measurement to enable change and sustain the value
Now let’s look at the third set of metrics and these are really aimed at sustaining the value. Once the project is launched, there are new processes for customers and employees. It may take some time to get the organization’s muscle memory right and hit the end state ROI goals. If we use the end state metrics (i.e., the sales cycle is six months), we can’t adjust levers for a very long time, and we may lose iterations and learning time. So we introduce both early and late stage metrics.
In the example above, early metrics might be: match rate, engagement, pages read, time on site, new content, and personalized article selections clicked based on match. This gives a good read on the new process from a metric perspective. It can be put on a dashboard for momentum and learning. And provides an early look into whether the right things are happening at the top of the funnel, whether our match technology is working well and how much the personalization engine is making a difference on the newly identified visitors.
Once we have adjusted the early phases and have the processes and technology working well, we can look at late stage metrics. At this point, they are more relevant and could be: completed CTA forms, Digital Opportunities, Qualified Buyers, Time from Awareness to Opportunity, Content Quality (who uses it and how often). As you can see, some of these late stages are difficult to track up front but are dependent on getting the new processes correct and are critical to the business case.
This entire measurement system is part of a larger analytics-based decision-making model, that allows businesses to really understand the handoffs in their enterprises from a data perspective. Knowing the volume, timing, efficiency, and outcome of each process provides the basis for an intelligent look into inefficiencies and bottlenecks. Integrating customer behaviors then allows us to use analytics to predict issues, trends, opportunities and any upcoming changes in the market for which we want to take advantage. For example, if we de-anonymize visitors and find that 20 or so unique visitors from a single company (maybe even one of our Account Based Marketing targets) are all binging on content on how to buy one of our products, there may be a sales opportunity there. And if we see a trend of 10 companies in the same industry exhibiting this behavior, we may see a wave of sales opportunities we may want to better understand and gear up to win.
If you would like to talk more about KPIs, our library of metrics, the latest cool digital projects, please click here and we’ll set up some time.